
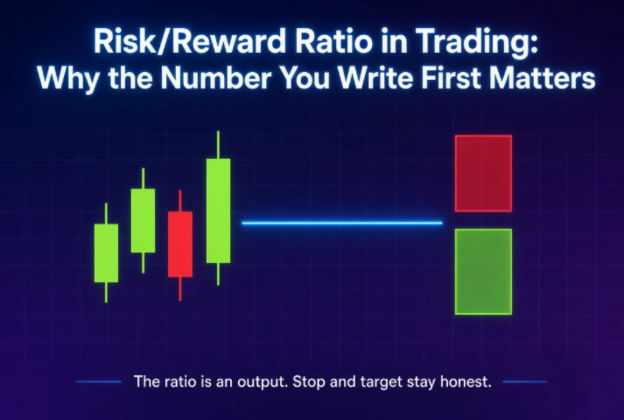
Learn how the risk/reward ratio works, how spreads affect real trading results, and how proper position sizing helps protect your account from large losses.
Two traders take the same number of trades, in the same market, using the same setup. One ends the year profitable. One ends it down. The difference is not prediction accuracy. It is the number each trader writes down before placing an order: how much can be lost versus how much can be made. The risk reward ratio in trading determines this relationship precisely, before any trade begins. Understanding it, combined with honest position sizing, is what keeps a losing streak from becoming a permanent exit from trading.
What the Ratio Measures and How to Calculate It
The risk/reward ratio compares two distances on a chart: entry to stop-loss, and entry to take-profit. Divide the first by the second. A trade that risks 20 pips to make 40 pips has a ratio of 1:2. One that risks 50 points on the S&P 500 to make 150 has a ratio of 1:3.
Position size does not enter the calculation, which is why the ratio transfers across instruments and account sizes. A gold trade risking $30 to make $90 and a Bitcoin trade risking $300 to make $900 are the same 1:3 ratio expressed in different magnitudes. The ratio is a shape, not a dollar amount.
The practical calculation: entry at EUR/USD 1.1001, stop at 1.0981, target at 1.1041. Risk is 20 pips. Reward is 40 pips. Ratio is 1:2. Every dollar at risk is matched against two dollars of potential gain.
The Number the Ratio Cannot Tell You
A risk/reward ratio in isolation tells you nothing about whether a trade will be profitable over time. A 1:5 ratio can belong to a losing strategy. A 1:1 ratio can belong to a profitable one. What connects the ratio to actual profitability is the win rate, and the two numbers cannot be evaluated separately.
Every ratio has a minimum win rate required to break even. The formula is: required win rate equals risk divided by the sum of risk and reward.
At 1:1, you need 50%. At 1:2, you need 33.3%. At 1:3, you need 25%. Flip it: at 2:1 (risking two to make one), you need 66.7% to break even.
Put money behind these numbers over 100 trades at $100 risk each:
Win 35% of trades at 1:2: 35 wins of $200 against 65 losses of $100. Net result: $700 up. Win 20% of trades at 1:3: 20 wins of $300 against 80 losses of $100. Net result: $2,000 down, from a ratio that looked conservative. Win 45% at 1:1: 45 wins of $100 against 55 losses of $100. Net result: $1,000 down, despite winning nearly half of all trades.
The middle example is the one that produces the most confusion. A trader running a 1:3 ratio and winning 20% feels like they are disciplined. The math shows a strategy destroying capital at $2,000 per 100 trades.
What Spread Does to the Ratio You Drew on the Chart
Almost every explanation of risk/reward ratio omits the single most important practical detail for short-horizon traders. The ratio calculated from chart prices is not the ratio produced in the account. The account transacts on the bid and ask, not the single midline price on the chart. The gap between them is the spread, and it lands entirely on the risk side.
EUR/USD shows 1.1001 on the chart. The actual quote is 1.1001 bid, 1.1002 ask. You buy at 1.1002. If the stop at 1.0981 is hit, you sell at 1.0981, losing 21 pips. If the target at 1.1041 is hit, you sell at 1.1041, gaining 39 pips. The ratio on the chart was 1:2. The ratio in the account is 21 against 39, which is 1:1.857. The breakeven win rate moved from 33.3% to 35%.
One pip on a 60-pip trade is barely visible. But watch what happens as the trade distance shrinks:
| Stop | Target | Spread | Actual risk | Actual reward | Actual ratio | Breakeven win rate |
|---|---|---|---|---|---|---|
| 20 pips | 40 pips | 1 pip | 21 pips | 39 pips | 1:1.86 | 35.0% |
| 10 pips | 20 pips | 1 pip | 11 pips | 19 pips | 1:1.73 | 36.7% |
| 5 pips | 10 pips | 1 pip | 6 pips | 9 pips | 1:1.50 | 40.0% |
| 5 pips | 10 pips | 2 pips | 7 pips | 8 pips | 1:1.14 | 46.7% |
A trade planned as 1:2 needing 33.3% win rate becomes 1:1.14 needing 46.7% when the stop is 5 pips and the spread widens to 2 pips at the session open or around a news release. That is 13.4 percentage points of additional win rate required from a change in timing alone. The strategy that backtested profitably on midpoint prices can lose money live because of this discrepancy.
The fix is straightforward: measure stop and target from your actual entry price (the ask when buying, the bid when selling), not from the chart line. Add the commission where applicable and the overnight swap where the trade crosses a settlement. The ratio that comes out of that calculation is the one that matters.
The Three Ways Traders Destroy Their Own Ratio
Having a calculated ratio is not the same as having a protected ratio. Three behaviours systematically destroy it after entry.
Moving the stop closer to manufacture a better ratio is the first. A setup offers 1:1.5 but the trader wants 1:3. The stop moves in, the number on the screen improves, and the trade gets worse because the stop is now inside the normal noise range for that instrument. A stop hit by random intraday movement that resolves against no directional thesis is not a loss with a controlled size. It is an unnecessary loss. Stop placement belongs at the price where the trade thesis is demonstrably wrong. Moving it to hit a target ratio changes neither the market nor the outcome. It changes only the paper calculation.
Extending the target to justify an entry is the mirror problem and easier to miss in real time because nothing about it feels like a concession. Targets set beyond the first significant resistance are targets that get approached, rejected, and reversed before filling. The target should be where the price is likely to reach given the specific structure at hand, not where it needs to be for the ratio to look good.
Moving the stop after entry to avoid realising a loss is the most damaging. A planned 1:2 trade where the stop is moved from 20 pips away to 40 pips away when price is at minus 15 pips has become a 1:1 trade at best, with the stop now at a price the trader chose under emotional pressure rather than analytical discipline. This is the mechanism that converts a sequence of small planned losses into a single large unplanned one. The ratio is only a constraint if it is honoured after entry.
Position Sizing: Where the Ratio Connects to Account Survival
The ratio tells you the shape of each trade. Position sizing converts that shape into an account impact. Without explicit position sizing, even a structurally sound ratio cannot prevent a single trade from doing serious damage.
The standard approach is to define the maximum percentage of account equity that can be at risk on any single trade, typically 1% to 2%, and to calculate position size backward from the stop distance.
Account equity $10,000. Risk per trade 1% = $100. Stop distance 50 pips on EUR/USD where one pip equals $10 per standard lot. Position size = $100 risk divided by (50 pips × $10 per pip per lot) = 0.2 standard lots.
This calculation has to happen before every trade, not once at account opening and then forgotten. When the stop is tight, position size is larger. When the stop is wide, position size is smaller. The dollar risk stays fixed at 1% regardless of how confident the trader feels about the setup.
A trader who sizes every position by this formula can lose 10 consecutive trades and lose 10% of their account. A trader who sizes by feel and puts 20% of the account into a single leveraged trade can lose everything on one bad read. The ratio determines expected value over many trades. Position sizing determines whether enough capital survives bad runs to allow that expectation to play out.
Consecutive Losses: What Probability Says About Surviving Them
A common reason traders abandon sound strategies during drawdowns is that they have not done the calculation of how many consecutive losses a given win rate implies.
At a 50% win rate, the probability of six consecutive losses in 100 trades is approximately 55%. At 35% win rate, the probability of eight consecutive losses is approximately 69%. At 25% win rate (the breakeven rate for a 1:3 strategy), the probability of ten consecutive losses in 100 trades is approximately 79%.
A trader running a genuine 1:3 strategy should expect and survive ten consecutive losses as a normal statistical event. If the position sizing puts the account down 30% after ten straight losses at 3% per trade, the account may not recover psychologically or practically before the next winner arrives. At 1% per trade, ten consecutive losses is a 10% drawdown that leaves 90% of capital intact and the trader in a position to continue.
The ratio and the win rate determine expected value. Position sizing determines whether the account survives long enough for that expected value to be realised.
Setting the Stop First: Why the Ratio Is an Output
The operational implication of everything above: the ratio is calculated after the stop and target are placed, not before. It is a measurement of what the setup offers, not a target that the setup must be made to reach.
Start with the stop. Place it at the price where the trade thesis is wrong. On a breakout, that is back inside the range. On a trend pullback, it is beyond the swing low that defined the pullback. Then check the stop distance against the instrument’s average true range on the relevant timeframe. A stop set inside a single daily ATR on a daily-timeframe trade will be hit by noise before the directional move has time to develop. The stop needs to be wide enough for the trade to breathe without being so wide that the dollar risk at the intended position size exceeds the maximum per-trade risk.
Only then look at the target. Place it at the next significant level where price is likely to face genuine selling pressure or where the measured move from the pattern completes. Divide the reward by the risk. Whatever number comes out is the ratio this trade offers.
If that ratio is below the breakeven line for the actual historical win rate on this type of setup, pass on the trade. There is no third option that involves adjusting the stop closer or the target further until the numbers are acceptable. Both adjustments make the trade worse while improving the appearance of the ratio. The trade either offers an acceptable ratio at honest stop and target placements, or it does not.
Conclusion
The risk/reward ratio is the most important number to calculate before any trade, and the most commonly misread one after it is calculated. It cannot tell you whether any individual trade will work. It can tell you, combined with an honest win rate measured over hundreds of trades, whether a strategy has positive expected value. Spread degradation converts the chart ratio into a smaller account ratio, with the effect growing sharply as trade distances shrink. Position sizing converts the ratio from a shape into a dollar impact, determining whether the account survives the losing streaks that every positive expected value strategy generates. And the discipline of placing stop and target at technically honest levels, then reading the ratio as an output rather than engineering it as an input, is what separates the ratio as an analytical tool from the ratio as a way of talking yourself into a trade that does not merit taking.
Guest articles and opinions are the author’s own and not necessarily shared by Monierate. This content is for informational purposes only and does not constitute financial advice. Trading involves significant risk, so please do your own research before making any decisions.
